Viewport
The viewport is where imaging data and acquisition and live analysis planning graphics are displayed. The axes are in a sample relative coordinate space, so if the scaling is calibrated with the Stage Scanner Alignment or by setting the objective resolution, then distances in this space are measured in microns.
Basic Controls
To zoom in and out in the axes, scroll the scroll wheel of the mouse.
To pan the axes in XY, click and drag the middle-mouse button.
Right click in the viewport for simple commands related to available features of ScanImage. Similarly, you can right click over specific graphics rendered in the viewport for options pertaining specifically to those graphics.
Basic Elements in XY
The Viewport has many depictions of useful things:
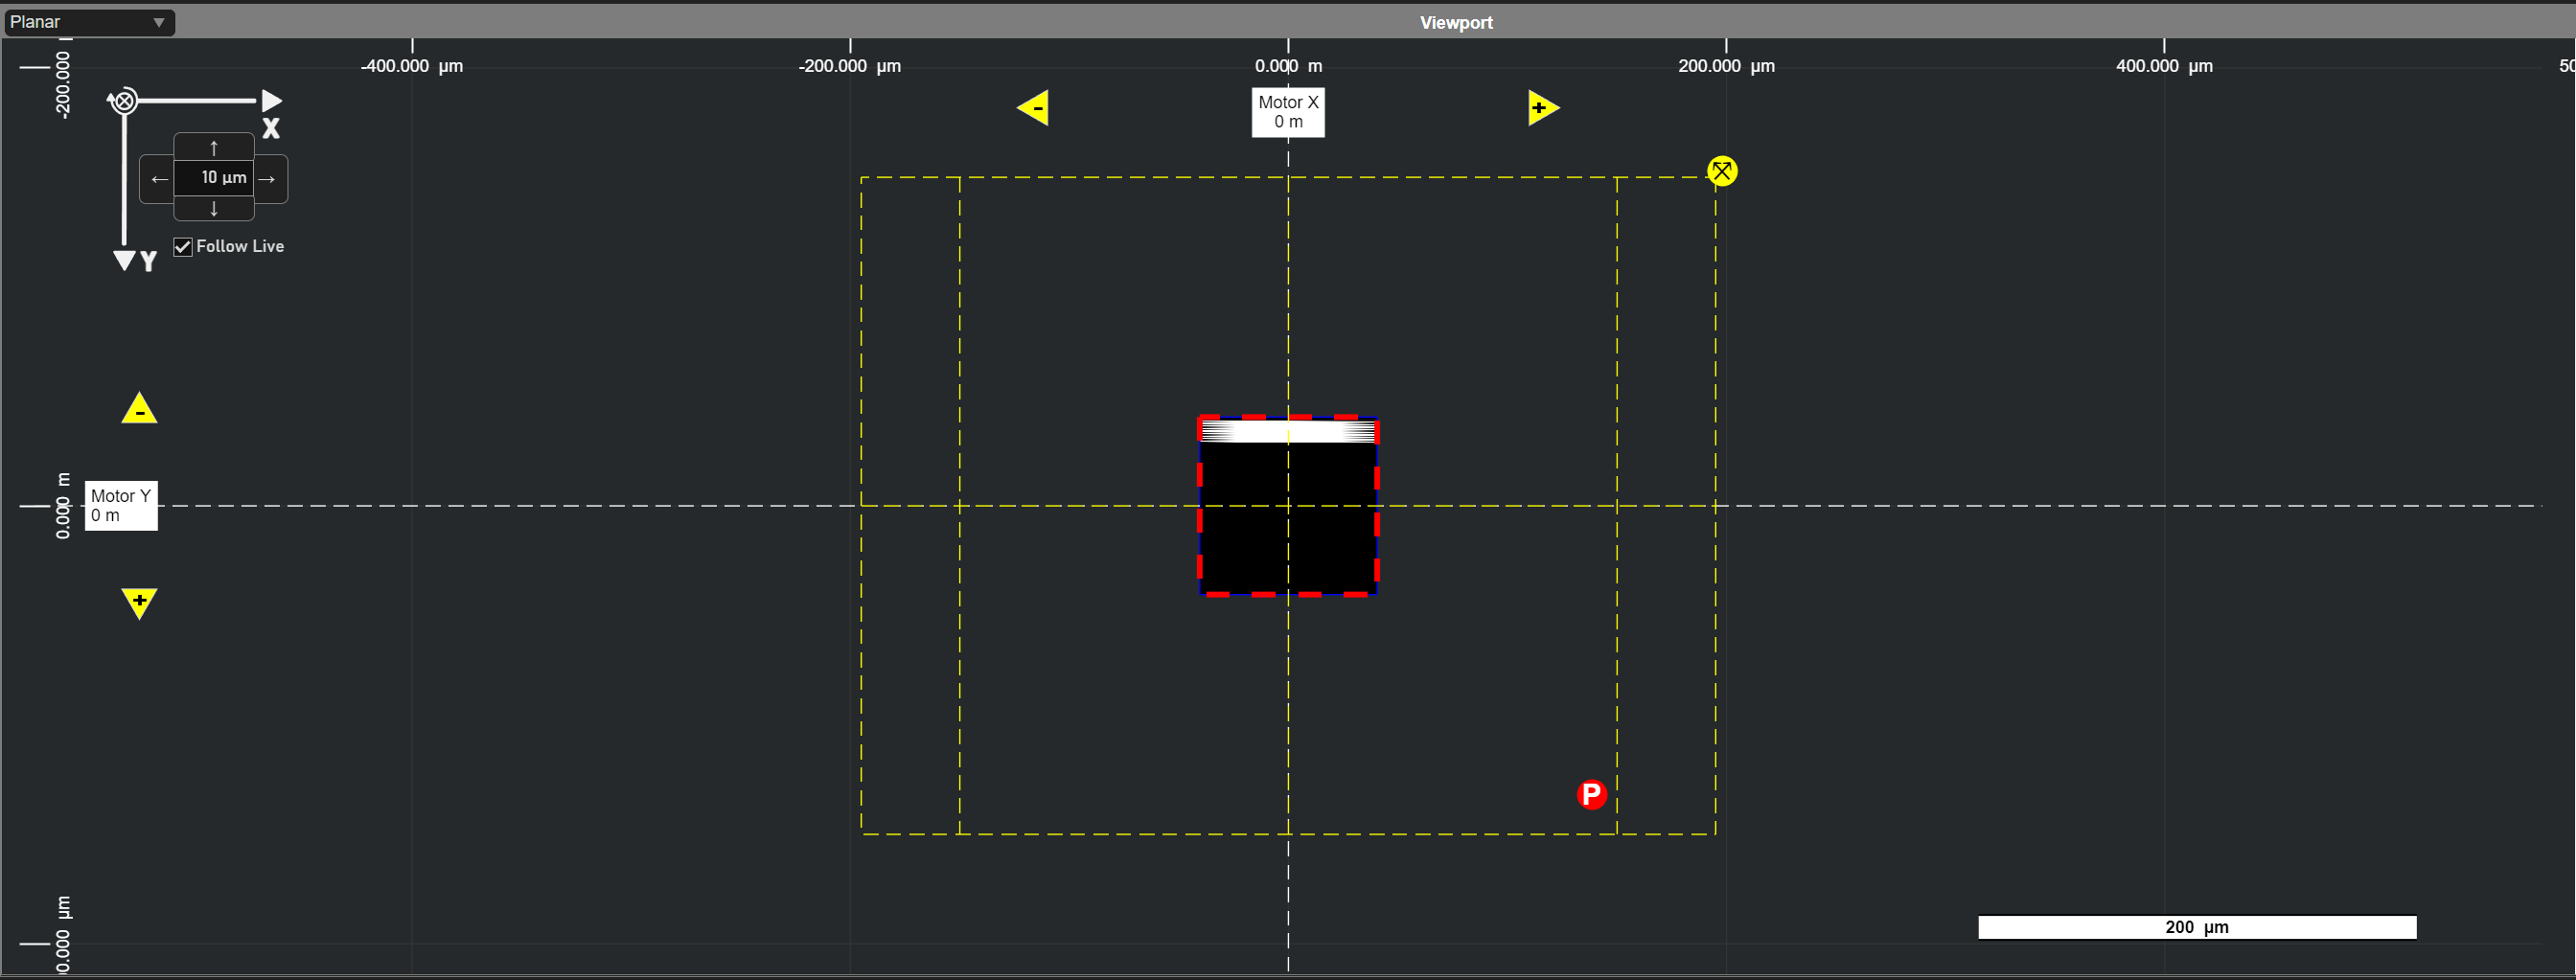
Scanner FOV
The scanner FOV is depicted with a dashed line at the extents of travel of the scanner. The imaging scanner uses a yellow dashed line. An optional stimulation scanner uses a dashed white line. These are depicted in the Scanner Coordinate Space.
Park Position
The scanner park position is depicted with a P circle marker.
The user can click and drag the marker to set the position that the
scanners settle in when not acquiring.

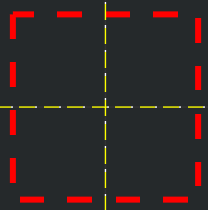
Default Imaging Group ROI
The default imaging group’s ROI is used to determine where the scanner images when the multiple regions of interest feature is disabled. Its outline can be clicked and dragged to move it. After it is selected, you can the scale by clicking and dragging the corner points.
Tip
Holding control while dragging the corner points operates as a corner drag rather than symmetric scaling
The scanfield can also be rotated by clicking and draggin the rotation handle after the ROI has been selected.
Annotations
Annotations like text, lines, and circles can be added from the Background controls of the Display Settings panel.
Motor Controls
XY is depticted following the right hand rule. For typical systems with objective pointing down, this has the positive Y direction pointing down on the screen.
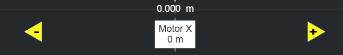
The stage position is depicted at the top and side of the axes in boxes and also across the viewport with white dashed lines.
To drag the stage position in just X or just Y, one can click and drag these boxes.
To drag the stage position in XY arbitrarily, there are two options:
click and drag the crossed arrows marker at the corner of the Scanner FOV
ctrl + left-click and drag to move the stage.
To input a stage position to go to by keyboard, double click one of the boxes.
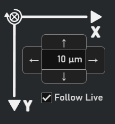
To step the stage by an increment, click the arrow buttons at the top-left of the viewport.
The Follow Live checkbox determines whether the FOV is kept in the center of the Viewport
throughout stage moves. When tiling or cycling, it may be desired to disable this.
Scalebar
ScanImage features a scalebar by default which scales with the size of the Viewport in microns.
Basic Elements in Z
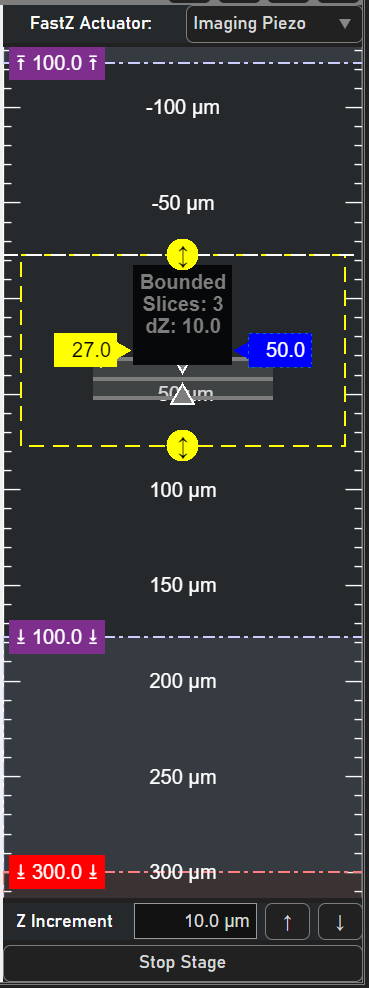
For systems with objective pointing downwards, the positive Z direction is down - towards the sample.
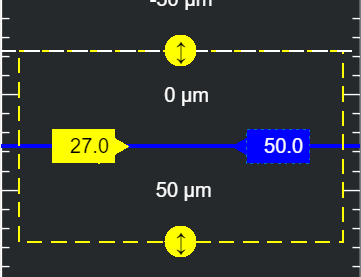
Display Slider
The display slider is the yellow slider on the left side.
Its function is to determine which elements are visible in the XY viewport based on the Z it is set to. Its Z is shown in the sample relative coordinate system.

Actuator Slider
The acutator slider is the blue slider on the right side.
Its function is to move the fastZ actuator with left-click and drag action.
You can also double-click it to manually input the position. It’s position is shown and given in the reference coordinate system - this is useful so that you can specify the position of the actuator relative to the upper and lower travel bounds as given from the fastZs resource configuration page.

Paired FastZ Dropdown
If multiple fastZ devices are paired with the imaging scanner, the user can select for which fastZ device the current actuator position and stack definition apply.

Z Range
The range of the selected fastZ device is depicted with a yellow dashed line. If no fastZs are paired, then this is simply a line.
At the top and bottom of the range are crossed arrow markers which can be clicked and dragged to move the Z stage.
Stack
Stack slices are depicted in gray. They can be dragged in Z via left-click and drag. Arrows at the top and bottom allow the top and bottom of the stack to be redefined also by click and drag. Double-clicking the stack allows manual input of stack parameters such as step size.
There are several keyboard shortcuts for defining stacks which can be revealed by right-clicking the stack.

Motor Controls
At the bottom of the ZView, there are buttons to step the z stage position and also stop z-stage movement.

Stage Drag Limits
In purple are stage drag limits. Stage drag limits prevent a left-click and drag of the stage from going further than intended when stage dragging. At the conclusion of a stage drag, the limits adjust to the appropriate relative stage dragging limit.
Absolute Stage Limit
In red, The absolute stage limit prevents the stage from moving past a position. Zeroing the sample relative coordinate system does not affect the stage position beyond which moves are rejected.
Groupings of Elements
The viewport has graphics grouped by coordinate systems they are conveniently plotted in and by function. While it is not strictly necessary for the user to be aware of coordinate systems in many use cases, it is good to be aware of a few of them. See the coordinate systems page.
Groupings and nesting of groups can be viewed from the Layers panel in the Display tab of the Auxiliary Panel.