Display Settings
Feature: Acquisitions
The Display Settings panel controls how live and background images are rendered in the Viewport. In ScanImage 2025 and onwards it is an overlay panel docked to the top-right of the Viewport rather than a tab in the left panel. It is shown and hidden with the Display Settings button at the bottom-right of the Viewport.
Control |
Description |
|---|---|
Display Settings |
Toggles visibility of the Display Settings overlay panel. The panel opens upward from the button and contains the Display Coordinate System, Histograms, Layers, and Background controls described below. |
Note
The channel table, physical channel settings, and scan phase controls that previously lived on the Display tab now reside on the Channels tab.
Display Coordinate System
The Display Coordinate System controls determine the coordinate space the Viewport axes are drawn in and how the data is projected.
Control |
Description |
|---|---|
Display CS |
Selects the coordinate system the Viewport is rendered in. |
2D |
When checked, the Viewport renders a flat top-down (XY) view. When unchecked, the Viewport renders a rotated 3D view and the Z Scale slider becomes available. |
Z Scale |
Scales the Z axis aspect ratio of the 3D Viewport display without changing the underlying data values. Only available when 2D is unchecked. |
Histograms

Histograms for live display modes.
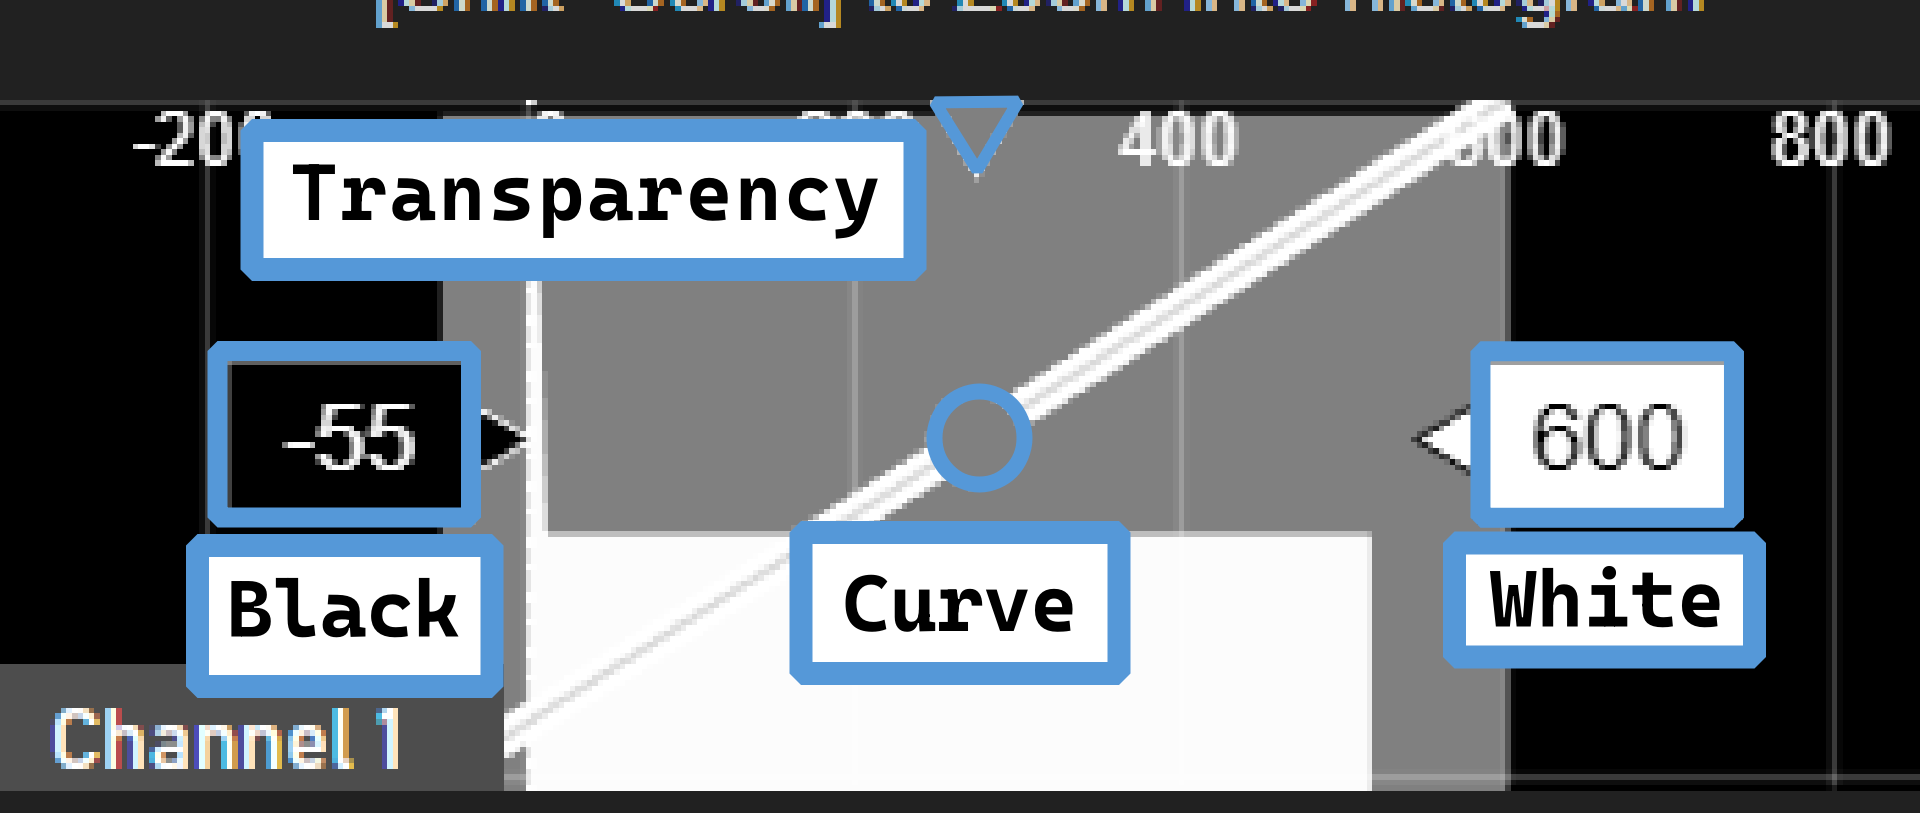
If no background images are selected, the default controls for the histogram panel allow for adjusting the contrast, transparency, and primary color of the live image in the viewport.
Control |
Description |
|---|---|
Transparency |
Controls the alpha of the channel. The lower the node is placed, the lower the visibility of the channel compared to the other channels. |
Black/White |
Controls the black/white limits of the image. Pixel values below the Black node will be displayed as all black, and pixel values above the White node will be displayed as all white. Tip Changing the histogram color will tint the live image white values to the chosen color. |
Curve |
Adjusts the interpolation curve between the black and white contrast limits. Moving the node left or right will bias the display of the image pixel values towards the black or white limits. |

Histograms with pinned backgrounds selected.
When a background image is selected (See Image Controls), the histogram panel changes to allow for the same contrast, transparency, and color configuration of the image in the viewport as if it were the live image. The controls for the histogram are the same as in the Live Histogram mode but only apply to the selected background image.
Tip
To return to Live Histogram mode, hit the esc key.
Tip
To match the viewport color to the configured histogram channel color of the currently selected image, use the “Set Color” button under Image Controls
Layers

The Layer control panel allows for user control over visibility, interactivity, and locatability of relevant features in the viewport.
Column |
Description |
|---|---|
|
Clicking on each icon will focus the viewport camera view on all relevant elements in the space/feature layer. |
|
Toggles mouse interactivity of each space/feature layer. |
|
Toggles visibility of each space/feature layer. |
 |
| 
 |
| 
 |
|  /
/  |
| 
Background

Image Controls
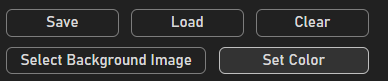
Image buttons
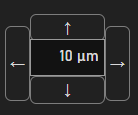
Image movement controls
Button |
Description |
|---|---|
Save | Load |
Saves/Loads the current background image to/from file. |
Select Background Image |
Enables a tool to pin a context image. |
Set Color |
Synchronizes the current pinned histogram color with all pinned background images. |
↑↓←→ |
Moves the currently selected background image in the given direction for that distance |
Grid Controls

Control |
Description |
|---|---|
Grid Spacing |
Sets a constant grid spacing in the viewport. Tip Hit backspace while editing the field to revert the grid space to the default “Auto” spacing size |
Bold |
Toggles bolding of the grid lines in the viewport. |
Annotation Controls
Control |
Description |
|---|---|
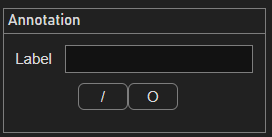
Label |
Adds a label annotation to the viewport. |
“/” | “O” |
Enables a drawing tool for annotating lines and circles onto the viewport. |