FastZ Tuning Window
Fast Z Actuator Tuning Window
Introduction
When using a FastZ actuator for volume scanning, it is important to carefully choose parameters to ensure desired results. The most common actuator used for fast Z is a piezo which moves the objective lense. Due to the mass of the objective, the actuator may not be able to keep up with the control signal if the desired scan is too demanding. This can produce a volume scan that does not span the expected depth and/or has a phase offset from the expected depth. The new actuator tuning window allows you to see the response of the actuator for the command signal and adjust parameters to account for the actuator performance.
Tip
The Stack basic feature tutorial describes the tuning process in detail.
Actuator Tuning Window Controls
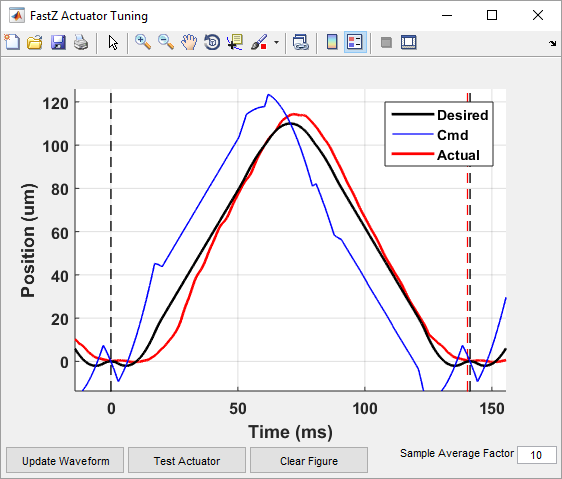
The main view of the actuator tuning window shows a plot of actuator position (vertical axis, microns) plotted with respect to time (horizontal axis, milliseconds). The following elements are present on the plot:
Solid black plot: Plots the desired actuator position. This is the ideal position that the Z actuator should be at during the scan.
Solid blue plot: Plots the command signal that will be/was actually sent to the actuator. Based on parameters set in the FAST Z CONTROLS interface, this might be different from the desired position in order to account for the actuator performance.
Solid red or dashed red plot: Plots the actual response to the command signal. This line will not be present if the test has not yet been run. If the test has been run but parameters have changed and the results are outdated, this line will become dashed.
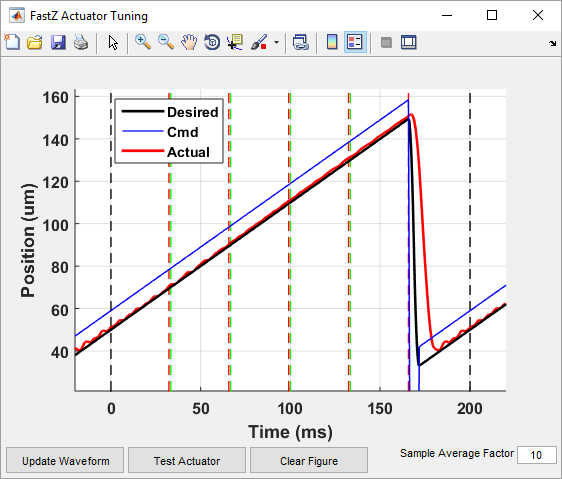
Vertical dashed black lines: These lines indicate the start and end of the volume, including flyback frames.
Vertical dashed green lines: Each green line indicates the start of a frame (slice). The green line is only displayed for frames after the first. The start of the first frame/slice is the black line that indicates the start of the volume.
Vertical dashed red lines: Each red line indicates the end of a frame (slide). If there is space between the last red line and the black line indicating end of the volume, this is a flyback frame.
There are several controls at the bottom of the window:
Update Waveform |
Updates the desired waveform and command waveform plots but does not actually execute the test. This allows you to see what will be sent to the actuator without actually starting the output |
Test Actuator |
Updates the desired waveform and command waveform plots and executes the test by outputting multiple cycles. The response plots the results of the test |
Clear Figure |
Clears all plots from the view |
Sample Average Factor |
Implements sample averaging on the response waveform. This can be useful if the position sensor data is noisy |
For details on how to effectively use this tool to improve volume scanning results, view the fast Z tuning concept guide.
Examples
Sawtooth waveform:
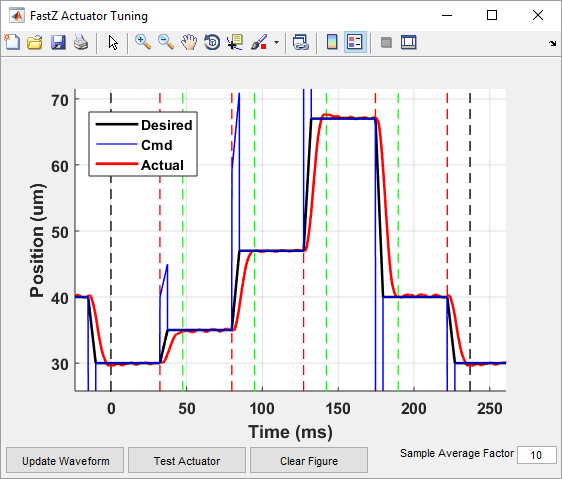
Step/settle waveform:
3D arbitrary scan waveform: